Web app · for investors
Research on the web
Screen stocks, open any ticker and read its options intel beside the chart. SPY is free without an account; a free account adds 20 full analyses a month.
Open free SPY intel
 How it works
No options trading required
Simple and actionable data built using 55 institutional studies
Complete Options intel
6 groups with 25 indicators to cover major effects like volatility or hedging
All-rounded vision
4 signal types covering direction, strength and momentum of each indicator
Evidence depth
15 years of Point-in-time data with transparent performance metrics
Web app · for investors
Screen stocks, open any ticker and read its options intel beside the chart. SPY is free without an account; a free account adds 20 full analyses a month.
Open free SPY intelAPI · for builders
Support and resistance levels, fundamentals, technical indicators, news and macro in your own code: 15 years of point-in-time data on a free key, with launch kits to start from.
Get a free API keyNot investment advice. Indicators and levels are model outputs, not price targets.
Official ContributorVS × IBKR

Webinars, research, and podcast appearances published on IBKR Campus as part of our ongoing partnership with Interactive Brokers.
See all on IBKR Campus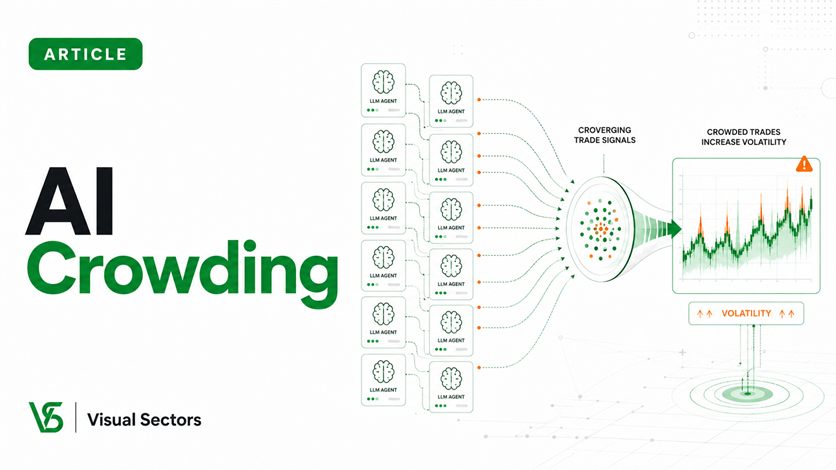 IBKR Quant
VS × IBKR
Can LLM-Based Trading Systems Increase Market Volatility?
IBKR Quant
VS × IBKR
Can LLM-Based Trading Systems Increase Market Volatility?
 Webinar
VS × IBKR
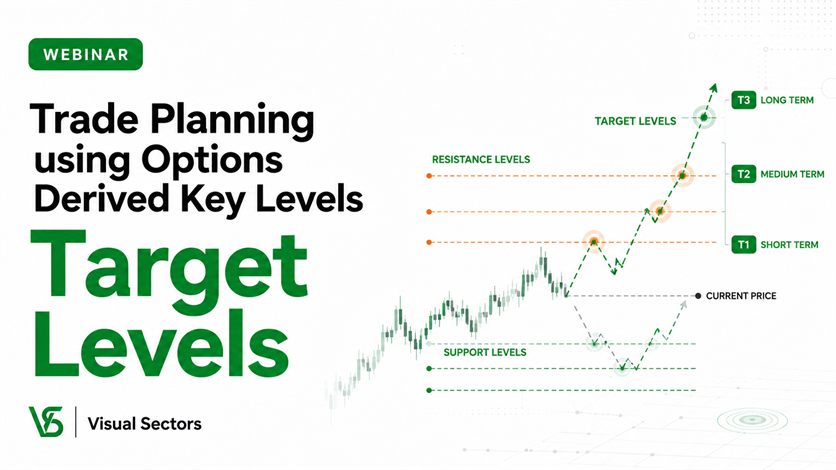
Trade Planning using Options Derived Key Levels
Webinar
VS × IBKR
Trade Planning using Options Derived Key Levels
 Webinar
VS × IBKR
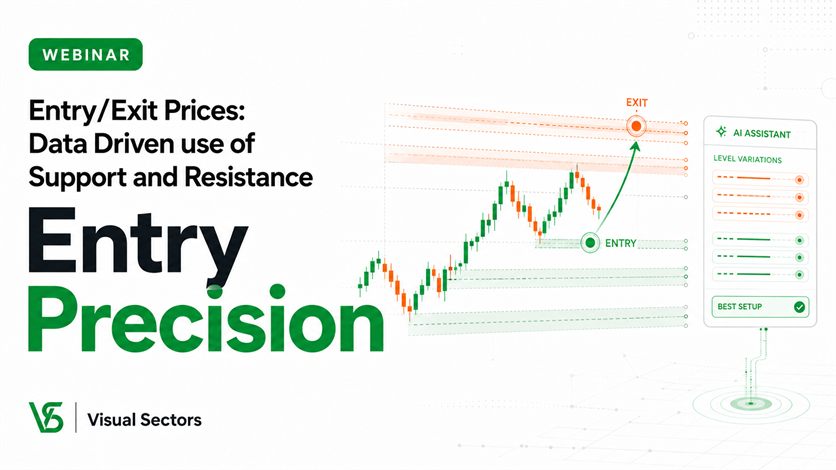
Entry/Exit Prices: Data Driven use of Support and Resistance
Webinar
VS × IBKR
Entry/Exit Prices: Data Driven use of Support and Resistance
 Webinar
VS × IBKR
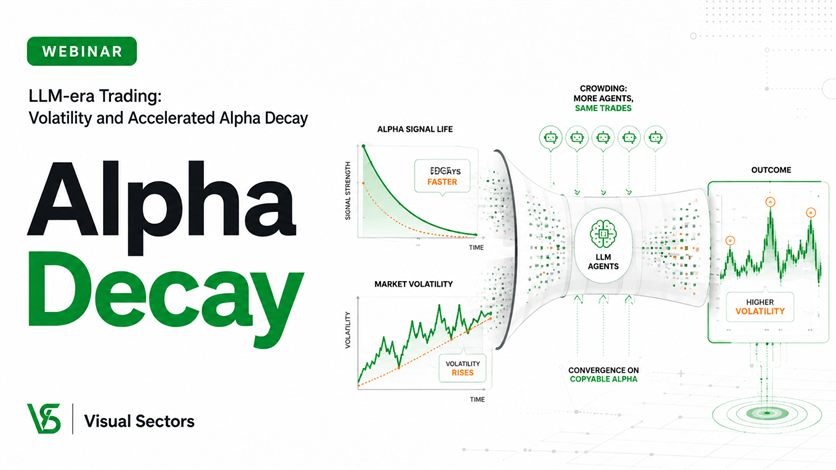
LLM-era Trading: Volatility and Accelerated Alpha Decay
Webinar
VS × IBKR
LLM-era Trading: Volatility and Accelerated Alpha Decay
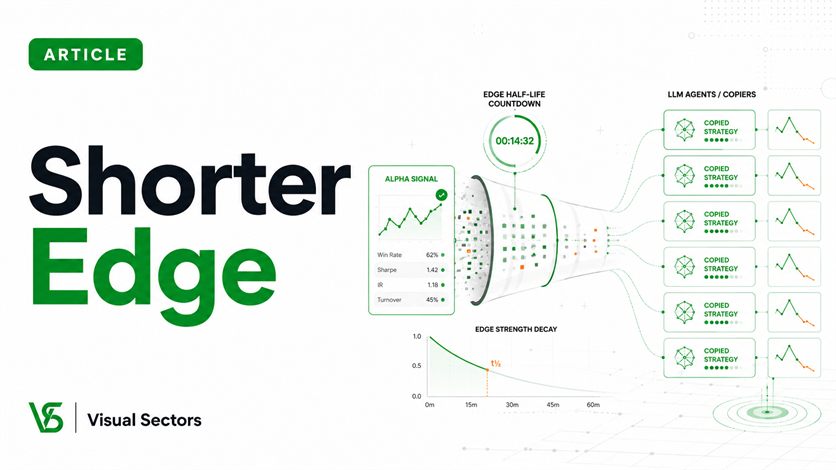 IBKR Quant
VS × IBKR
LLMs and the Shortening Shelf Life of Copyable Alpha
IBKR Quant
VS × IBKR
LLMs and the Shortening Shelf Life of Copyable Alpha
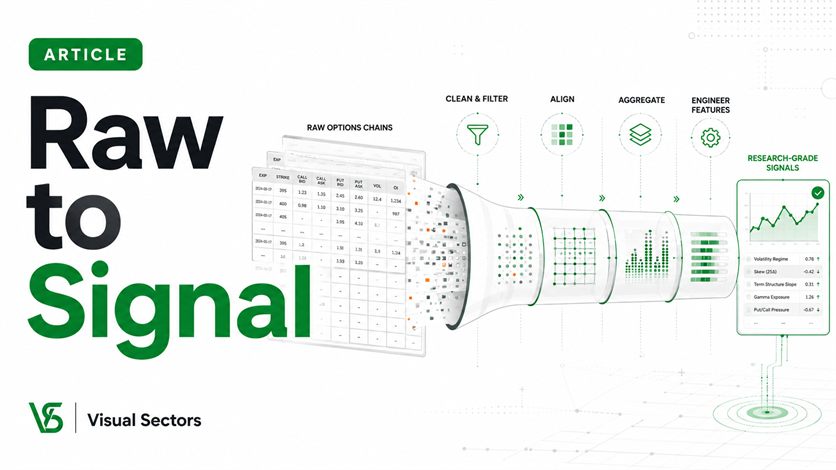 IBKR Quant
VS × IBKR
From Raw Chains to Research-Grade Signals
IBKR Quant
VS × IBKR
From Raw Chains to Research-Grade Signals
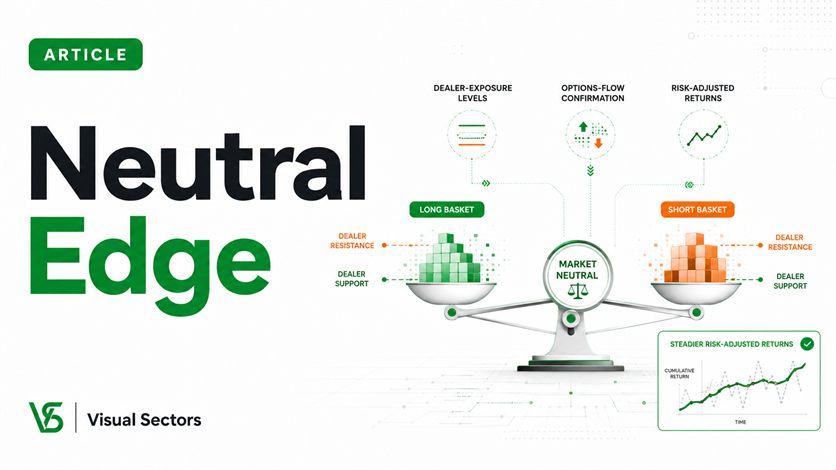 IBKR Quant
VS × IBKR
Equity Market-Neutral Trading with Dealer-Exposure Levels and Options-Flow Confirmation
IBKR Quant
VS × IBKR
Equity Market-Neutral Trading with Dealer-Exposure Levels and Options-Flow Confirmation
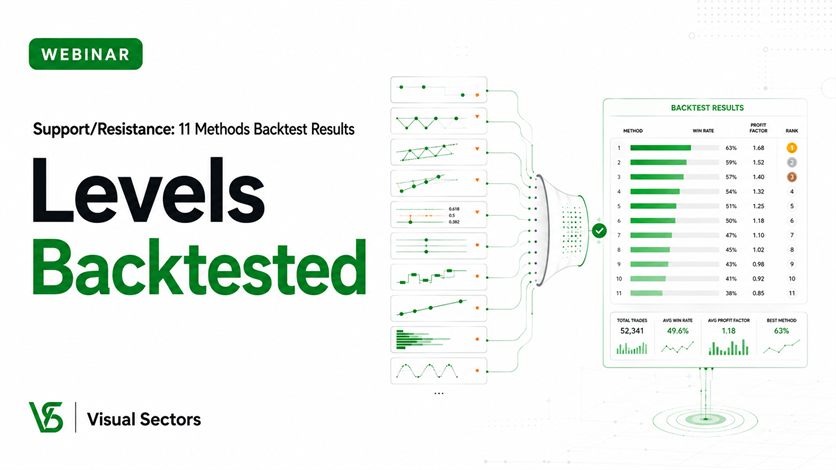 Webinar
VS × IBKR
Support/Resistance: 11 Methods Backtest Results
Webinar
VS × IBKR
Support/Resistance: 11 Methods Backtest Results
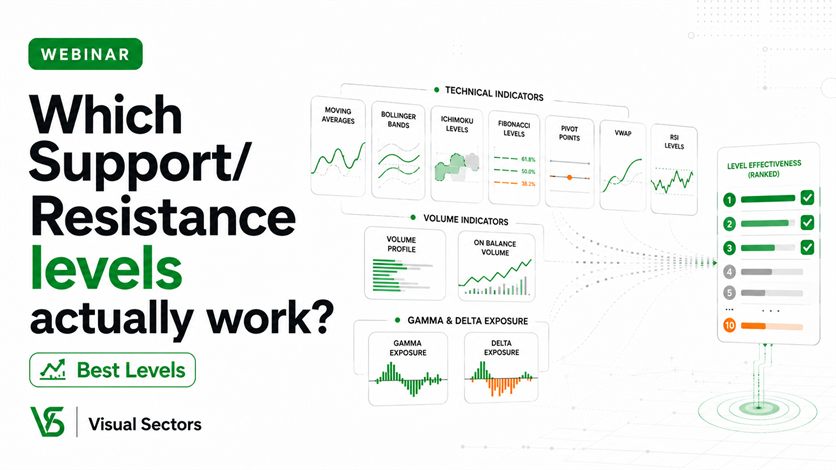 Webinar
VS × IBKR
Which Support/Resistance levels actually work?
Webinar
VS × IBKR
Which Support/Resistance levels actually work?
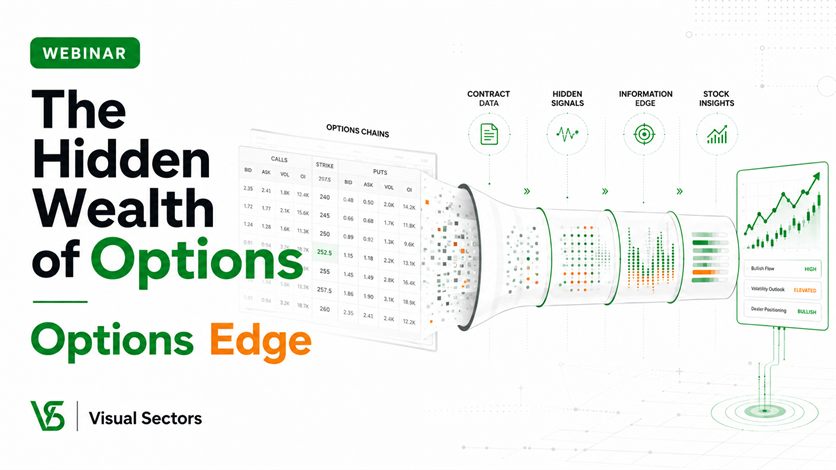 Webinar
VS × IBKR
The Hidden Wealth of Options
Webinar
VS × IBKR
The Hidden Wealth of Options
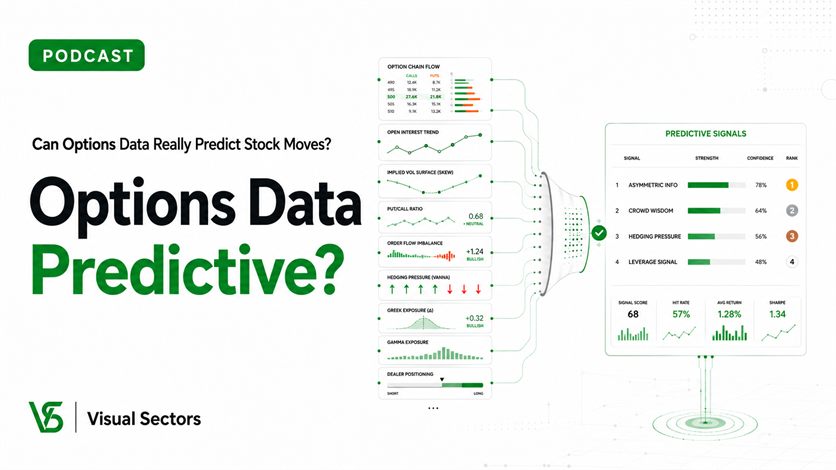 Podcast
VS × IBKR
Can Options Data Really Predict Stock Moves?
Podcast
VS × IBKR
Can Options Data Really Predict Stock Moves?
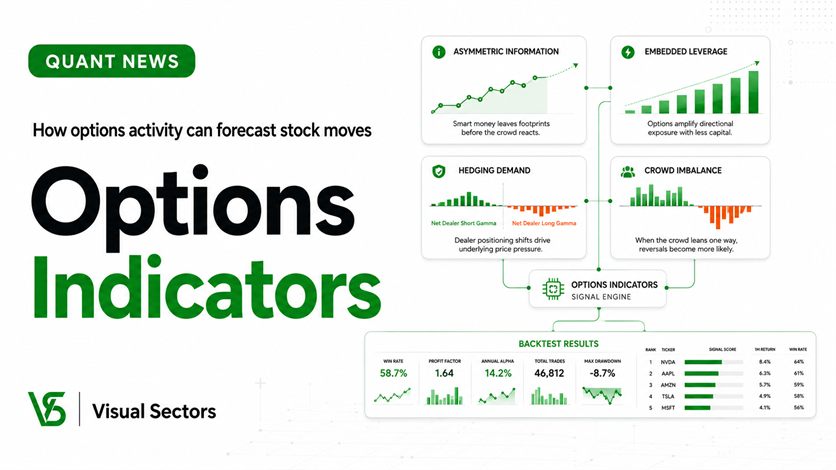 IBKR Quant
VS × IBKR
Options Indicators
IBKR Quant
VS × IBKR
Options Indicators
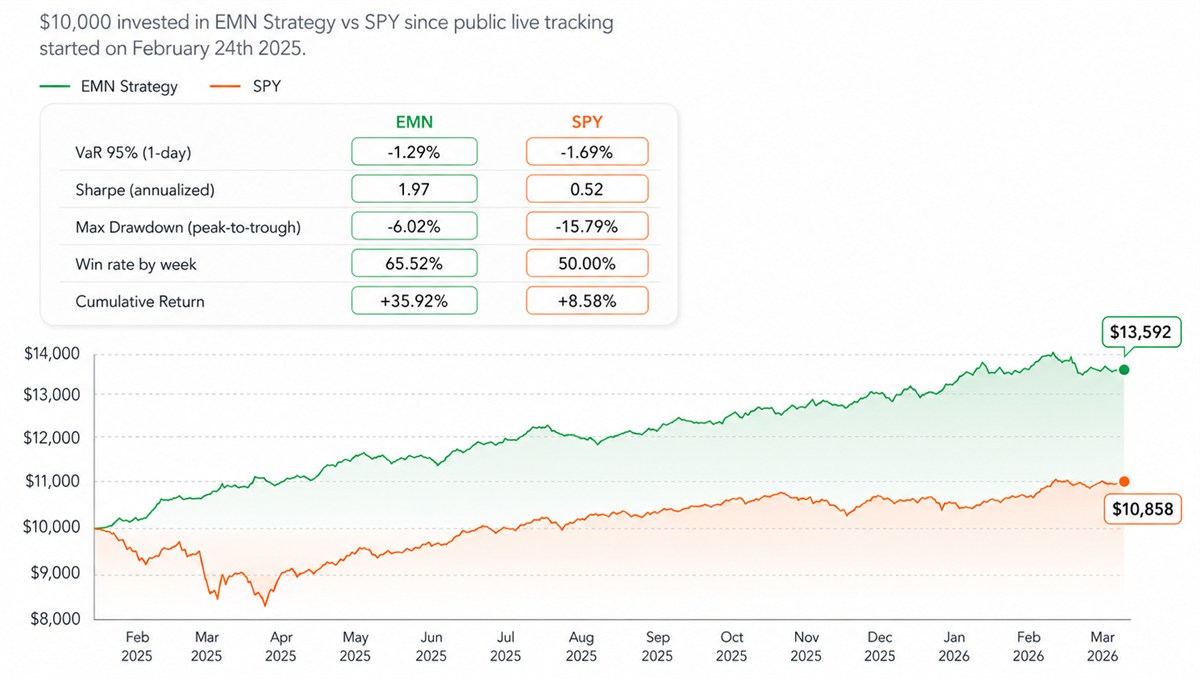
The team’s own funded account, trading our Market Neutral strategy, over 13 months from 24 February 2025. These are the team’s trading results, not the output of the product and not what a subscriber will earn. Past results do not predict future ones.Track record band Figures from one funded account the team trades with the Market Neutral strategy, over the 13 months in the caption. A drawdown is the largest fall from a peak; the Sharpe ratio is return per unit of volatility. One account over one period: they do not describe the product’s signals or any subscriber’s results.
Use cases
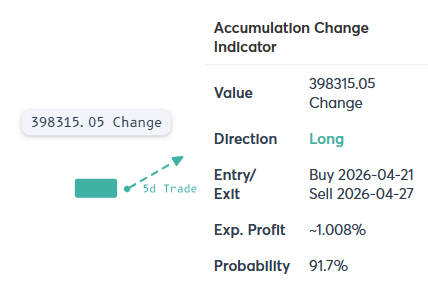
Direction, entry/exit, expected profit and probability — pulled live from our single-stock view.
Flexible screener + AI assistant to find ideas working for your exact style.
| Ticker | Vol | Gamma | Opt Vol |
|---|---|---|---|
| AAPL | 1.2x | 100% | 100k |
| MSFT | 1.5x | 120% | 150k |
| GOOG | 1.8x | 150% | 200k |
Rankings based on multiple parameters to find perfect long-short candidates.
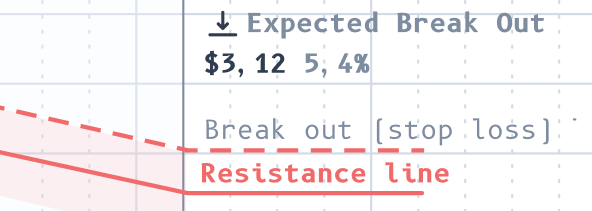
Statistically derived break-out and resistance lines with confidence ranges.
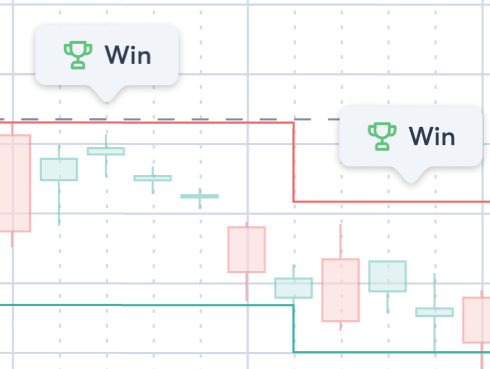
Historical wins around predicted support and resistance lines, marked on chart.
Right-size every trade against your account and the stock's ATR.
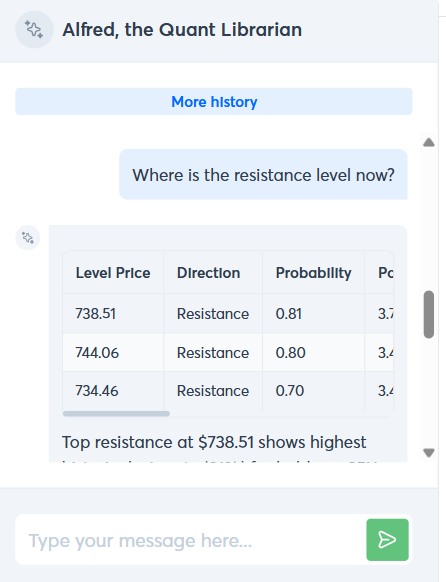
Ask Alfred for live levels, direction and probability — answers grounded in our data.
Plug your agents into our indicators, levels, and historical data.
Open-source skills for backtesting, sizing, and risk management.
Why trust us
 Carlos SalasData Science
 Anton VaninData Engineering
 Alex Kurinets, CFA, FRM, CAIAQuant Research
 Rustam IskenderovData & Distribution
Market-Neutral Strategy
Live for 13 months. +35.92% vs SPY +8.58%.
Publicly tracked since 24 Feb 2025. $10,000 in the EMN strategy vs SPY — higher Sharpe, lower drawdown, higher win rate, lower VaR.
Proprietary options-derived indicators
Machine-learning models in production
Backtests performed
Started with a $4,000 account and inconsistent results. The first 15% month became my a-ha moment — Visual Sectors data has helped me return more than 30% in 2025 so far.
Ten success stories of Visual Sectors users — how the product evolved to help traders get better, more consistent results, and exactly how it made money for our customers.
I didn't have a lot of trading experience when I attended the Market-Neutral workshop. A couple of weeks later I was able to lock in profit just following a simple 3-step process.
Visual Sectors models deliver strong returns on multiple occasions, and the risk profile of the strategies allows trading stocks with a valid mathematical expectation of positive returns.
Each statement is one person’s experience. Individual results vary and do not guarantee future returns. Identity and consent verified for all testimonials.
FAQ
Our Market Neutral strategy is designed to be managed in under 30 minutes a week — entries, exits, and rebalancing all run from a single weekly dashboard.
Positions are held over multi-day windows and alerts can be delivered via email or webhook, so you can manage the book from anywhere.
No. We provide data, indicators, and educational tooling. You make every trading decision.
Yes — outputs are broker-agnostic. We integrate natively with Interactive Brokers and export to anything via CSV / API.
Our levels and indicators are sourced from options-market activity and validated through 758,000 backtests, not retail charting heuristics.
No. The signals are translated into clear directional and level-based outputs you can act on with stocks alone.
Every plan includes access to our community and direct support from the research team.
The web app is plug-and-play. Only the MCP / agent layer requires technical setup, and that has a guided installer.
We are an information and analytics provider, not a registered investment adviser. All our outputs are educational.
Cancel any time and keep the period you have paid for. We refund the part of a subscription you have not used, and run packs while their runs are unspent. The Data API’s Pro plan has its own full refund within 14 days. The terms of sale have the details.
No one can. We can show you the historical performance of our strategies and the live-reported funded account results.